
How to Use Accelimate AI's Audit Trail to Troubleshoot a Broken Workflow
November 1, 2026
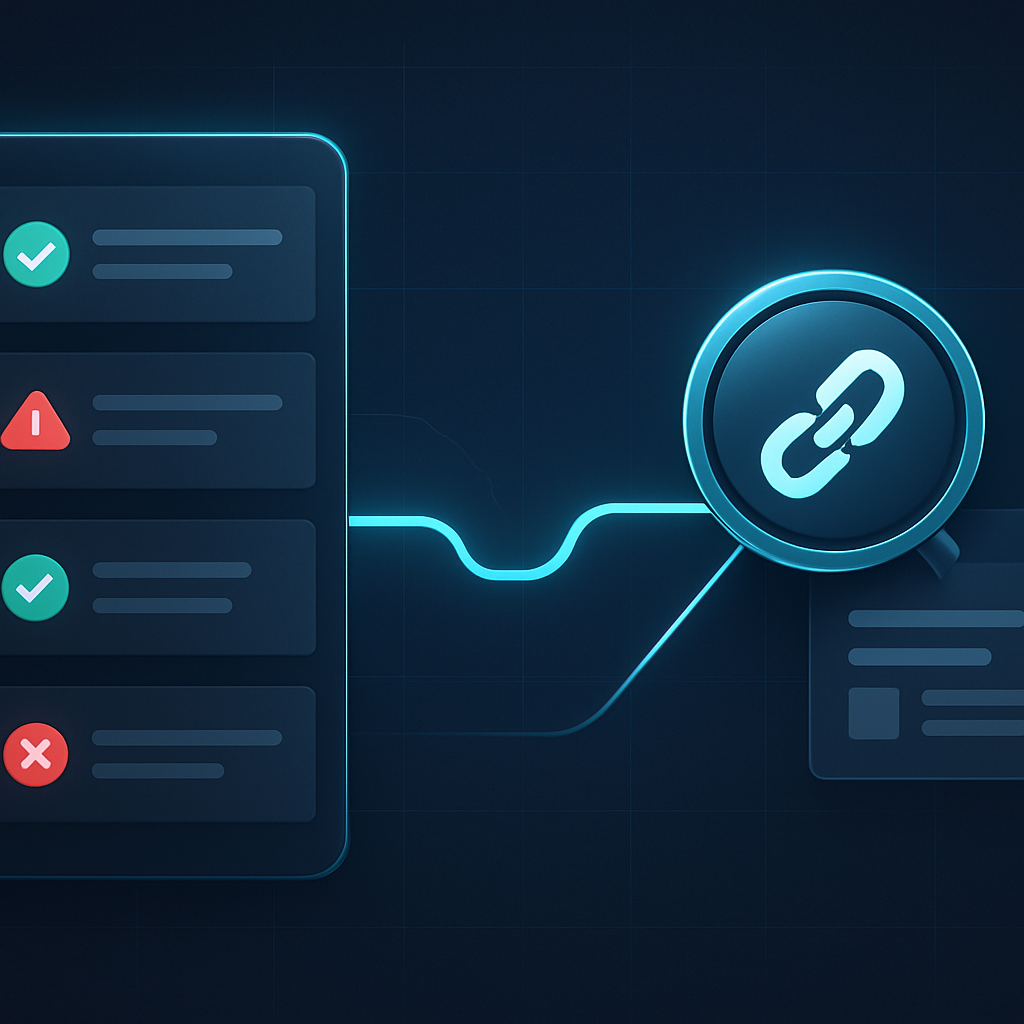 Silent workflow failures are easy to miss and hard to trace without the right tools. This tutorial shows how to use Accelimate AI's audit trail to identify the exact step, data condition, or branch decision that broke your automation.
Why Silent Failures Are the Hardest Automation Problem to Solve
When you troubleshoot an AI workflow audit trail, you are looking for a specific moment when a process handed off data incorrectly, hit a condition it could not resolve, or simply stopped without logging an obvious error. Silent failures are common after the first few weeks of running automation, when edge cases start arriving that the initial setup never anticipated. Most teams burn hours combing through system logs that were never designed to tell a clear story. Accelimate AI's built-in audit trail is designed to surface that story in minutes.
This tutorial walks through exactly how to use it.
What the Audit Trail Actually Records
Every workflow that runs inside Accelimate AI generates a structured execution record. That record captures the state of each step in sequence, including the inputs it received, the outputs it produced, any conditions it evaluated, and the timestamp of each event.
Think of it less like a raw log file and more like a flight data recorder. Even if the workflow finished without an explicit error message, the audit trail shows what every step saw and what it decided to do next. That distinction matters when a process completes but produces a wrong result, which is a much harder failure to catch than an outright crash.
What gets captured by default
- Step name and sequence position within the workflow
- Input data passed into each step
- Output data or response returned by each step
- Execution status (success, skipped, failed, timed out)
- Timestamps at entry and exit for each step
- Any conditional branches taken or skipped
You do not need to configure anything special to get this level of detail. Accelimate AI records it for every run by default.
How to Open the Audit Trail for a Specific Run
Start in the Workflows section of Accelimate AI. Find the workflow that produced the problem and open it. Along the top navigation you will see a Runs tab. Click it.
The Runs view lists every execution of that workflow in reverse chronological order. Each row shows the run's start time, duration, trigger source, and final status. If a run failed outright, it will show a red status indicator. If it completed but you suspect the output was wrong, it may show a green status, which is exactly the kind of misleading signal that leads teams astray.
Selecting the right run
If you know roughly when the problem occurred, use the time filter to narrow the list. If you received a complaint from a user or a downstream system, match that timestamp against the run list. Click the specific run you want to inspect.
This opens the execution detail view. On the left you will see the workflow diagram with each step color-coded by its outcome. On the right is the step-by-step breakdown with full data.
Reading the Audit Trail to Find the Failure Point
The execution detail view is where the investigation actually happens. Work through it in order, from top to bottom, rather than jumping to the step you suspect. Assumptions about where a failure started are usually wrong.
Step 1: Check each step's status in sequence
Look at the status column for each step. A step marked Skipped is often more informative than one marked Failed, because it tells you a condition was evaluated and not met. That branch of logic was intentionally not taken. The question is whether that was the right decision given the data in play.
Step 2: Inspect the input and output for each step
Click any step to expand its detail panel. You will see the raw input the step received and the raw output it returned. Compare those two things carefully. In many broken workflows, the problem is not that a step failed but that it received malformed or empty input from the step before it. The failure happened one step earlier than it appears.
A common example: a step that sends an email receives a contact object where the email field is null. The send step reports success because it ran without error. But no email was delivered. The audit trail shows the null value clearly in the input panel of the send step, and if you scroll back to the step that fetched the contact, you will often find the data was already missing there.
Step 3: Look at branch conditions
If your workflow uses conditional logic, open the condition step and review which branch was taken and why. The audit trail shows the evaluated expression alongside the actual values at the moment of evaluation. This removes guesswork entirely. You can see whether a value was compared correctly, whether a string case mismatch caused an unexpected branch, or whether a date comparison failed because the format was unexpected.
Step 4: Note timing anomalies
Each step shows its start and end timestamp. If one step took significantly longer than usual, that can indicate a timeout that was handled silently or an external API that returned slowly and caused downstream steps to work with stale or incomplete data. A step that normally takes two seconds but shows a 28-second execution time warrants a closer look at its output.
Using Audit Trail Filters for Recurring Problems
If a failure is happening intermittently rather than on every run, the Runs view's filter options become important. You can filter by status to show only failed or partially completed runs, then compare those records against successful ones from the same time range.
Look for a pattern in the inputs. Recurring failures often trace back to a specific type of record, a specific trigger source, or a specific time of day when external systems are under load. The audit trail gives you enough granular data to spot those patterns without needing to instrument anything manually.
Exporting run data for deeper analysis
Accelimate AI allows you to export execution records for a given time range. If you need to hand the investigation to a developer or share it with a support team, the export gives them a complete, structured account of every run without requiring them to have access to the platform itself. Select the runs you want, choose the export format, and download the file directly from the Runs view.
Fixing the Workflow After You Find the Problem
Once the audit trail has identified the specific step and data condition that caused the failure, the fix is usually straightforward.
- Open the workflow in edit mode.
- Navigate to the step that produced or received the bad data.
- Adjust the step configuration, add a data validation step before it, or add an error handler that routes unexpected values to a review queue rather than silently continuing.
- Save the updated workflow.
- Test it using Accelimate AI's manual trigger with a sample record that matches the conditions that caused the original failure.
- Confirm the test run's audit trail shows the correct path and correct output at each step.
That last step matters. Running the test and then reading its audit trail is the fastest way to confirm the fix actually addressed the root cause rather than masking it.
Building a Habit Around Audit Trail Reviews
Teams that check their audit trails on a regular schedule, even when nothing appears broken, catch degrading workflows before they become actual failures. A step that used to complete in one second but now consistently takes eight seconds is signaling a problem. A contact fetch that used to return full records but now returns incomplete ones means something upstream changed.
Set a standing review cadence. Once a week, open the Runs view for your most critical workflows and scan the execution times and step outputs. It takes less time than a post-incident investigation and keeps your automation reliable as the data and external systems it touches continue to change.
Open Accelimate AI's Runs tab for your most critical workflow today and check the last seven days of execution records before a problem has a chance to surface on its own.
Tags